Startup Investment Portfolio Game: Results
Back in 2011 I wrote a post titled “Startup Investment Portfolio Game” where I started a list of “companies I would invest in if I could” to look back on in the future. This post is intended show how the startup investment picks list would have done as a venture capital portfolio as well as provide a few observations and learnings looking back on everything.
The initial list contained 37 startups, and over the last 6 years I’ve been periodically adding companies to the list that I like, bringing the total to 144 startups today. The Wayback Machine has been taking snapshots of this list over time, which should help verify the dates that the companies were picked and that I haven’t changed anything (not perfect, but good enough). The results exclude companies added in the past 2 years as they haven’t had enough time to materially change in value, but I’ll highlight some of my favorites from those at the end.
Methodology
It is not a straight forward process to quantify the performance of a list of privately held companies. Even investors that do this for real have a hard time with valuing a private company portfolio, and they have full disclosure into all the terms and financials of the rounds and companies they invest in. Each approach and methodology has several flaws, and I’ll attempt to outline the tradeoffs with my own for this at the end – there are a LOT here. It’s clearly easier to settle on the “right investment approach” with data in hindsight to maximize returns, so my approach to measuring everything attempts to mitigate that.
I settled on blindly investing 10% of the next round amount of financing for the companies after the pick at any stage, at any valuation, and at any date in the future. We also don’t use techniques like pro-rata to minimize dilution to double down investments that seem to be doing well during later rounds of financing as this would be impossible to do objectively in hindsight. I used data from Pitchbook to look at the next round of financing after I “picked” the company, which usually has a post-money valuation amount (to calculate initial ownership), and also has the diluted ownership of those shares today.
As an example, the initial list picked Square on April 10th, 2011. According to Pitchbook, they previously raised $10.12m total through their Series A that closed 16 months prior. Their Series B was 6 months after the pick, where they raised $31.75m at a $232.92m post-money valuation, giving the Series B investors 13.6% of the company. Our scenario would invest 10% of the Series B amount of $31.75m (or $3.175m) giving us an initial ownership of 1.36% of the company. From additional rounds of financing, the Series B shares were diluted from 13.6% ownership to 10.49%, so we would presently own 1.05% of the company. Square is now publicly traded, so our initial $3.175m Series B investment would currently be worth $74.24m, which is a return of 24.4X.
This very obviously presents several flaws, including the “How is someone with no track record going to participate in these financing rounds?” and I’ll address some of those in the caveats section below. The purpose of this post is purely to quantify how this list would have done if someone was able to make the investments.
Results Summary
Of the 113 companies that were picked from over 2 years ago, 89 have raised an additional round of financing that we could participate in with our hypothetical investment (“what about the other 24?” is discussed at the end). If you invested 10% of the next round for those 89 companies, you would have invested $151.9m and your ownership would be worth $735m today, which is a 4.8X return before management fees. Between the 4 IPOs and other exits, $245m is realized and the other $490m is on-paper value. This would put our hypothetical investment fund among some of the best returning venture funds out there today, especially considering this doesn’t include follow-on investments with companies that are doing well (like Pinterest, Square, and Stripe – though those would be less distinguishable than today from their less-successful peers at the time).
If we avoid investing when the pre-money valuation of the next round is above $250m, we miss out on 5 of the 12 inevitable unicorns, but our capital invested decreases from $151.9m to $82.8m and we have a 7.5X return.
Raw Results
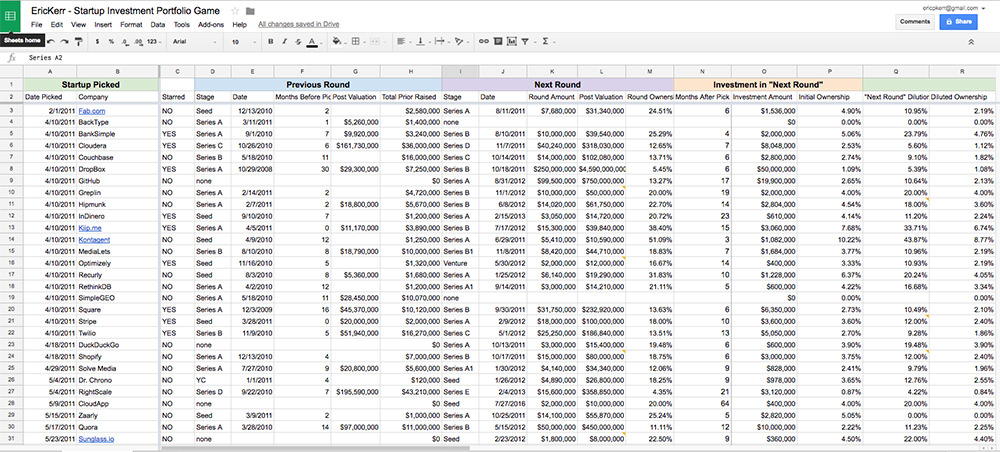 Startup Investment Portfolio Game Results
Company Highlights
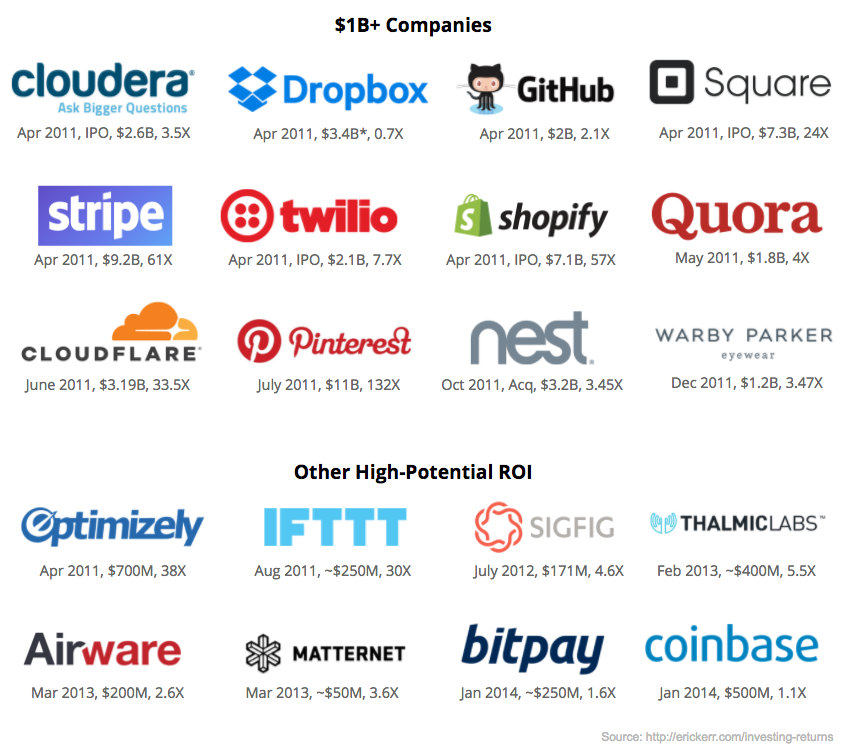
Of the first 89 hypothetical investments, here are some of the highlights. It’s interesting to note that just about all the good picks are from 2011, and it’s not clear to me if that’s because those companies have had the longest time to become valuable, that year was an especially good time to invest, or if I’m getting worse at this over time. It could very well be all three. A lot of these logos are very recognizable brands today, but that wasn’t necessarily the case when the picks were made.
Industry Comparisons
Correlation Ventures released a study that shows how venture financing outcomes are distributed from 21,640 financings between 2004 and 2013. Based on their data, only 4% of VC financings return more than 10X and only 1.5% return more than 20X. This data covers enough financings that we can loosely assume that it represents the probability of a return multiple for any VC investment.
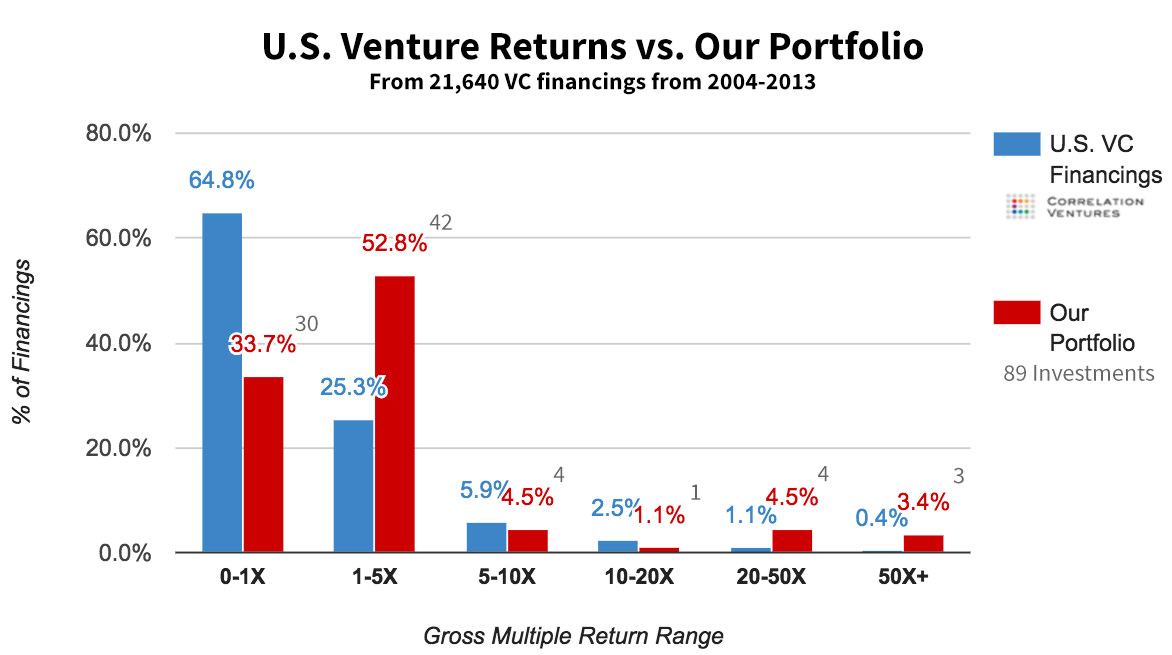
Modeling our investments as “trials” and successes in a Binomial distribution, we can calculate the likelihood that the investments picked and their return multiples are random. If you randomly chose 89 startup investments from the pool of all startup investments, we would expect to have 7 or more investments with 20X+ returns (like our portfolio) only 0.04% of the time (or once every 2,500 times). This is roughly the same as taking a coin and flipping heads 11 times in a row.
CBInsights ran a report breaking down the involvement of VC firms in billion dollar exits from 2004 to 2013. There were 45 billion dollar company exits that 104 VCs invested in, but 68 of them only participated in a single billion dollar exit. Sequoia, Greylock, and NEA each participated in 8 of the 45 billion dollar exits – incredibly impressive, and that’s with real money and not a fake hypothetical list.
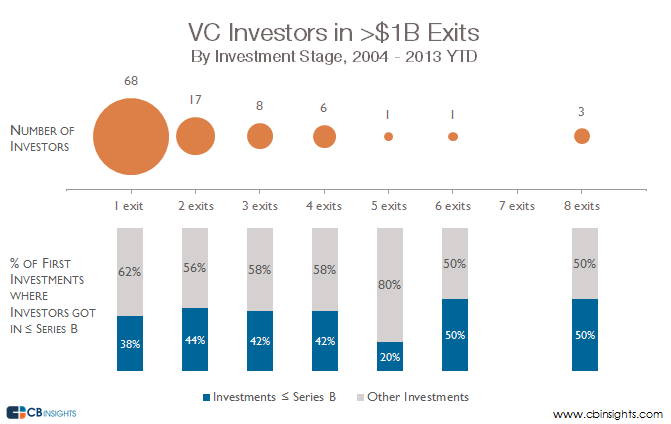
With outcomes this large, there is a BIG difference between investing in the Series A and Series D rounds, and they have vastly different return profiles. Investors in early rounds will see exponentially greater returns than later stage investors tagging along at the end for the logo. The 3 firms above are represented by the dot on the right and collectively represent 24 investment exits. 50% of those investments were in the Series B round or earlier.
Our list includes 5 $1B+ exits and an additional 7 companies that are worth that much on paper. Of those 12 unicorn companies on the list, we would have participated in the Series B round or earlier for 75% of them (vs. 8 and 50% above). The time periods for the two groups aren’t the same so it isn’t fair to directly compare, but this helps put things in perspective. In summary, the picks were fairly bold, early, and accurate.
Caveats & Observations
Getting into high profile deals (like a lot of these were for the logos above) is very difficult as there are usually a lot of iconic venture firms competing for the deal. This analysis in no way attempts to account for the likelihood that we’d even be able to get into the next round of financing. In short, that wouldn’t happen; and in VC, access is king.
It is also disingenuous to completely eliminate the 24 firms that we “picked” but never raised a follow-on round of investment. If our hypothetical venture firm had enough clout to get into the 89 deals this analyzes, some of the other 24 companies would have successfully raised another round that we would have participated in and likely lost money on. This is difficult to model, but I’m open to ideas for how to account for this. However, I don’t believe it changes the returns too significantly as 10 of those companies were acquired and the majority of the other 14 were at the Seed stage.
The original list includes a star mark next to some companies to indicate ones I thought were “extra special” opportunities at the time. Of the 89 investments, 47 have stars next to them. If you only invested in the starred ones, the returns increase from 4.8X to 6.0X. If you apply the $250m max pre-money valuation criteria limit as well, the returns increase from 7.5X to 10.9X. The increase in returns is primarily due to removing companies that aren’t Square, Pinterest, or Stripe and letting those command a greater percentage of the total capital initially invested. 7 of the 12 companies valued at over $1B have a star next to them, so I unfortunately wasn’t any better at pinpointing the unicorns vs. just putting them on the list to begin with.
Of the 12 unicorns in the list, the picks were made an average of 8.75 months before the companies’ next rounds of financing. GitHub hadn’t raised any money prior to our pick, and it was made almost 18 months before their $100m Series A investment from Andreessen Horowitz. Would any of these companies have done their round earlier?
A majority of the companies were discovered by reading blog articles, which are often about a financing round that we would have just missed out on. This isn’t too different from how a traditional firm discovers companies outside of their normal deal flow, but this analysis also assumes that we get into 0% of the companies’ previous rounds. If this was an actual venture firm, we would have a much different type of exposure to companies that are actively fundraising, and this would impact the returns our portfolio would have (though it’s also not clear if this is positive or negative).
Something that’s interesting here is the stark difference in how these companies were picked vs. how a traditional venture firm actually works. I’ve never been “pitched” by any of these companies, done any diligence on any of them, or even met any of the founders in person in the context of an investment opportunity. These companies are picked purely by reading about them, seeing what’s shipped so far, and digesting how the company portrays its vision for how the future will work. The picking process doesn’t consciously account for any of the other social signals that affect fundraising, but maybe that’s not a bad thing.
Of the picks from the last 2 years that aren’t in this analysis, some of my favorites are: PlanGrid, FlexPort, Starship, AirTable, Lilium, and Starsky.
This was a fun exercise, and I intend to keep updating the companies going forward. Maybe one day the list won’t be hypothetical. 🙂
 All original content is licensed under the Creative Commons Attribution 3.0 U.S. License except that which is quoted or attributed to others. You may reproduce or modify this content, but you must provide proper attribution.